
Data Visualization allows data analysts to gain insight from their Big Data much more quickly. It is also primarily used as an ideal communication tool between analysts and the company management.
When Big Data are compressed, a new Data Visualization challenge is generated due to the amount and diversity of the variables and data handled. Analyzing information through images is simpler, so:
Managers and Data Scientists using Data Visualization to present their data are 28% more likely than those using traditional dashboards to find data relevant for their analysis and predict trends in their business. This
- Improves decision-making
- Reduces time spent on analysis
- Facilitates trend prediction
Data Visualization Principles
Data Visualization is the most optimal way to expose the myriad of data within the reach of companies in the digital era, that is, Big Data. Thanks to this visual display of hundreds of variables and crosses* that a database can include, data analysts have a tool that can allow them to extract and present business insights much more quickly and reliably.
Principles for properly displaying information:
- Simplification: present the right amount of variables.
- Comparison: facilitate understanding and prevent mistakes from memory. It is important to be able to visualize all of the data in a single image.
- Know where and how to show the desired information to draw attention.
- Diversification: different representations of the same data may lead to new conclusions.
- Look for the reason why: Data Visualization’s goal is not to ascertain what is happening but rather to provide an easily interpretable way to display the myriad of data that a company has.
Data Visualization Techniques
Generating a graph from an excel table or even from SQL like those that have been used over the last few years is relatively simple. The variables barely exceeded 100 columns and not all were related to each other. However, as variables are added and interrelated, things get more complicated. Much more complicated.
For structured data, such as sales, revenue, and so forth, simple graphs are more than enough. But for unstructured data such as texts or images that have been captured by Big Data systems, other techniques are needed to adequately display the information.
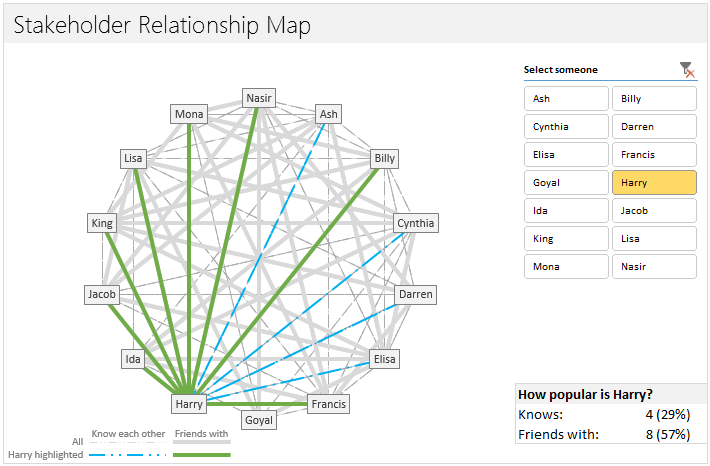
Relational Graphs
These are particularly useful for studying customers’ relationship with a company and the our products’ degree of penetration in each household. For instance, of a given telephone company’s customers, how many have only a cell phone line, how many have an entire package and how many have shown interest in additional services such as TV on demand or various types of coverage? How do these products relate to the consumers and what are the social and demographic data that match these groups?
Word Clouds
Word clouds are used to find the mode in a series of texts. They are particularly advisable for gaining insight from active listening to social media as they enable you to relate your brand or specific key words to comments about them, the feeling (good, neutral or bad) that marks these comments, and the volume of interaction they generate.
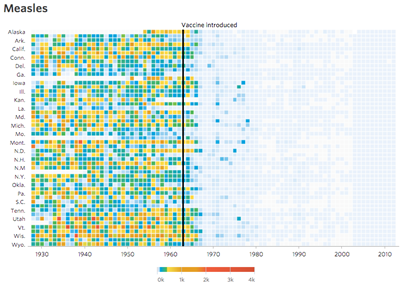
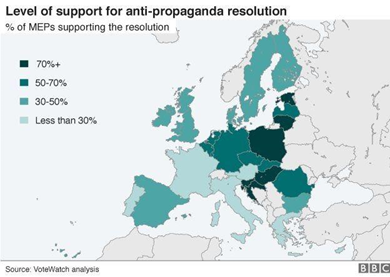
Designing Heat Maps
These maps can be grids or cartographic. They may be used to compare data that are very different from each other, for instance a company that wishes to measure the geographical penetration of its product or its potential clients in a given area as compared to their socio-economic status and their acquisition of similar products over time.
Grid
Mapping
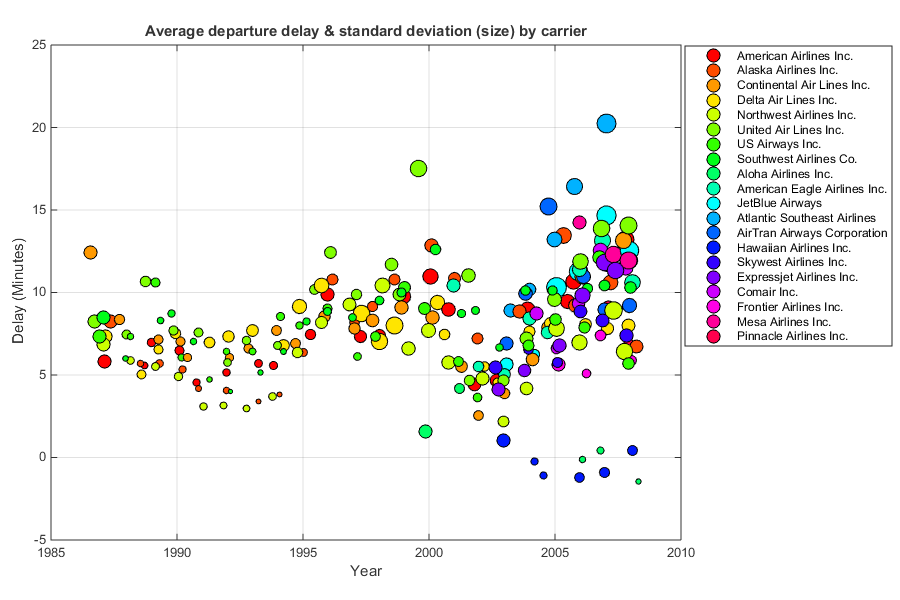
Dispersion Diagrams
These diagrams hark back to early Data Visualization given that, in and of themselves, they cannot show more than three variables for each record (placement on the axes and size of the representation on the table). However, if we make these graphs interactive, they help us display two levels of depth, i.e. the data that are of most interest to us based on the three most important variables. And by clicking on the specific data, we get a sample broken down with the rest of the variables that we establish.
For instance, in the following graph, one can observe the improvement or deterioration in the punctuality of various airlines between 1985 and 2010 through a measurement of the number of minutes’ delay for each takeoff. By clicking on each airline, we can access the presentation of the data that explain the causes of their improvement or worsening.
The key with Data Visualization resides in choosing the display that we want to give our data based on the type of conclusion we want to be able to draw. In other words, the display needs to be chosen according to the hypothesis that we want to demonstrate.
For further information contact with us using the following email: laguilera@datacentric.es
